One visualisation, one extension, one license, multiple capabilities!
The initial idea behind Inphinity Flow was to visualise processes. We wanted to bring the easy-to-implement possibility to enhance BI applications by adding something that’s often missing – the context of the process! BI applications are here because we generate tons of data and keep trying to find insights in it. Every single data point is generated as a part of the process – accounting closure, customer journey, support ticket process, vacation approvals… So, why aren’t we exploring the context of the process when analysing data? Because there hasn’t been an easy and intuitive option to do it with. There is now. Let’s use Inphinity Flow and bring this important process intelligence into analytics!
Inphinity Flow brings so much to the table in engaging users in the story behind the data. So much flexibility now in displaying a visual aspect that defines the process, the workflow, or the organization.
The 3 main areas for improvement are following:
Process understanding and optimization
Data lineage and calculation understanding
Advanced visual hierarchies
Single source of truth you can rely on
The sooner the better – spot an issue even before it becomes a problem
Content overview of a single app
Navigation through the Qlik environment
Navigation outside the Qlik environment
If you’re a technical person and still reading this, thank you for your determination. How can it help? Yes, I’m going to be very specific from now on 😉.
Get Inspired by this Video Showcasing Excellent Use Cases for Inphinity Flow
TRANSPARENCY
Inphinity Flow inspires data storytelling and does it in a very practical and engaging way. We finally have a tool to show real business context to decision-makers which increases the value of data dramatically.
Process understanding is a crucial part of… everything? Not knowing the process means you don’t see the end goal, don’t know how the data came to you, whether you can rely on it and who is waiting for your outputs. If one doesn’t know the process, he/she is part of, can he/she truly perform well?
Tip: You can create an internal application with Inphinity Flow as documentation of your main processes (as we did 😉) and/or incorporate the process visualisation in all applications to be sure users know the processes, what and why they’re doing in a specific app (the highlighting option can be very helpful for this purpose).
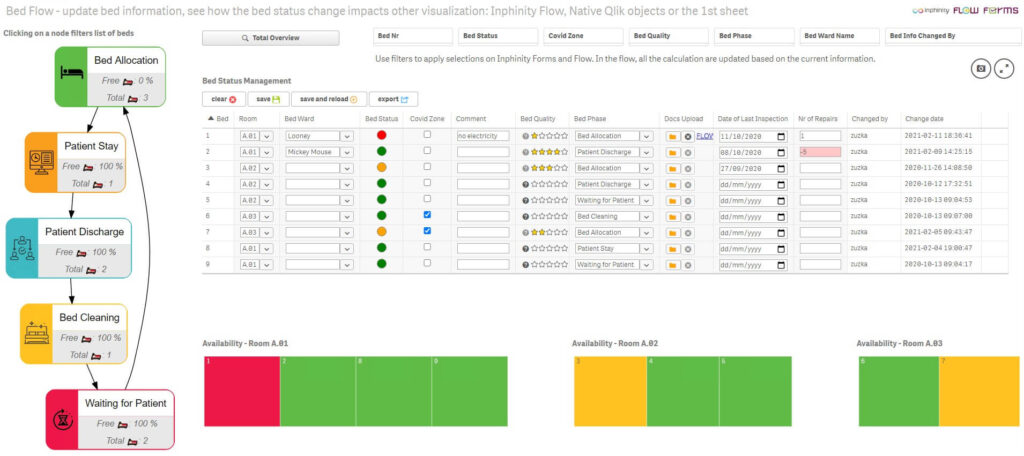
Data lineage (calculation understanding). How much time do you/your colleagues spend explaining how the specific number is calculated? How stressful is it to have this conversation with someone from the audit? How complicated is it to find results of intermediate calculations if the final output seems suspicious or you just try to understand it? We all know it well – simulation outputs, final numbers in accounting closure, final calculated price… – is it correct? I don’t think so but the inputs are correct. What’s the number in the 3rd step of the calculation?
Tip: Use Inphinity Flow to visualize the calculation, make it transparent – for you, for audit, for everyone (who should see it :D). You can use placeholders for measures on nodes to show intermediate calculation results and text on lines to visualize other metrics. Both defined by expression!
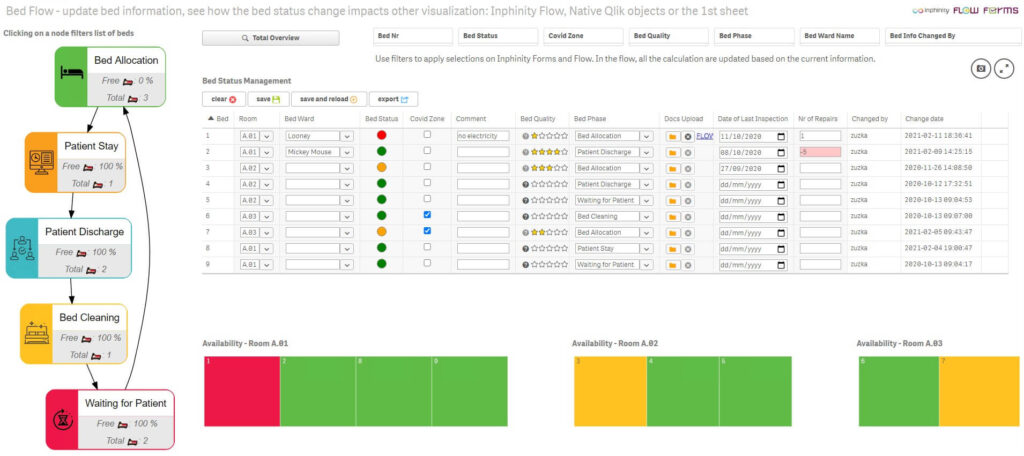
Visualise hierarchies to see data on all levels of aggregations together with their associations in one easy-to-understand object. Different categorisations, often used as drill-down dimensions, company structure, and hierarchy, that all can be visualised in a completely new and intuitive way.
Tip: Unleash the power of Inphinity Flow integrated with Qlik Sense. Inphinity Flow is based on a data model only. Define it right and once you select a specific category inside the hierarchy in Qlik, all other measures, visualisations, and KPIs will show only associated data.
RELIABILITY
Inphinity Flow has provided us with a fantastic new opportunity to help our customers to better understand their processes, see exceptions and take action on the process insights which was not possible so far.
Single source of truth. Having the process context in your data analytics tool makes your data more understandable and reliable. Since the data comes only from the data model, when you have the most actual and clean data in your Qlik app, the same you see within Inphinity Flow.
Tip: Use placeholder for measures on nodes to show the ownership of the process step/data in the step.
The sooner the better. Knowing the process and having it integrated with up-to-date data can save you time but also money. How? My favorite example is a contractual penalty. Something so specific and linked to the specific process that needs to meet deadlines. And, at the same time, it’s a use case all industries are familiar with. Due to the powerful combination of the Qlik associative data model and Inphinity Flow visualisation, you can spot an issue even before it becomes a problem.
Tip: Highlight issues by using emojis in both cases – when you use Inphinity Flow as a process visualisation and as a hierarchy. When managers open the app, they know exactly what is the priority and what they should be focused on in the next minutes or hours. Don’t hesitate to be creative and utilise actions on the node level to apply selections, set variable values, or open URLs.
SIMPLICITY
With Inphinity Flow we finally have native Qlik extension oriented to the business objective and not only to beautify the applications. We are now able to have actionable dashboards that give us insights to our business drivers.
Everything mentioned above have a common denominator – simplicity; but one very important area hasn’t been mentioned yet. We believe we want self-service analytics tools. However, with hundreds of apps, millions of data points, almost unlimited design options, and limited time, what users need is focus and guidance. Analysing data, going through the app sheet by sheet, making selections, looking for related documentation, opening other systems… that’s just another process. Inphinity Flow used as a navigation element helps you to keep users on track.
Navigation through a single app. My best practice is to add one intro sheet into every single app. It explains the purpose of the app and what is inside. With Inphinity Flow we can create an interactive overview of the content that the user can click on and it makes proper selections, apply bookmarks, and redirects him/her to a specific sheet or a story. All that in a Qlik style design.
Tip: Use custom nodes (colours and icons) to represent all parts of the app properly.
Navigation through the Qlik environment. Do you have tens of streams and hundreds of Qlik apps in your environment? Is QMC the only overview of them? And how many users have access to the QMC? In hours you can create a very valuable application as an overview of your Qlik environment, its structure, with all important information – descriptions, ownerships, last reloads, etc. This will be highly appreciated by newcomers as well as all users not working with Qlik on daily basis.
Tip: When you publish a new app, you can highlight it in this overview app instead of sending e-mails. It’ll help people to see this app as an important single source of truth about the environment they’re working in… And in a few months, they might stop asking you about the Qlik apps repeatedly 😉.

Navigation outside the Qlik environment. With the possibility to open any URL by clicking on a node within Inphinity Flow, why summarise only what’s inside your Qlik environment. Is there any important documentation on your intranet related to the process? Is the process directly linked with some cloud applications, e.g. JIRA or ServiceNow? You can open them directly from the Qlik Sense app – the app where users see the whole context of the process.
Tip: Notice that URLs can be defined by an expression. You can use buttons and variables to manage what specific URL should be open.

WE ARE SUPER HAPPY THAT OTHERS SAID:
Flow really does compliment any application. Not only is it easy to develop and implement and feels very native to use, but the latest release V2.0 now contains many more native like features which really does add that extra power between Flow and both your data model and application objects.
I really enjoy that I can change the color and design of different nodes because I usually use Inphinity Flow for something else than other processes (eg the organizational structure of the company).
Using Qlik content library for custom nodes is a brilliant idea! It’s really easy for developers to work with Inphinity Flow.
Inphinity Flow fits naturally into Qlik’s diverse set of native objects. While simple tables and standard charts are great, not every piece of information can be effectively described using them, and Flow fills the gap in visualizing any process of virtually any complexity.
Everything has a start and an end; therefore everything is Flow. The line is where the magic happens! With Inphinity Flow you can literally map out a whole company, its structures, dependencies, each and every process within each section or part of your business – This will bring ultimate value to Qlik customers.
BIG THANKS TO INVOLVED FOCUS PARTNERS

If you want to get technically inspired watch TechTuesday video series.
Follow us on LinkedIn not to miss any news from the Inphinity data analytics world!
Enjoy Flow 😉!
